library(marginaleffects)
dat <- transform(mtcars, cyl = factor(cyl))
mod <- lm(mpg ~ cyl, dat)
hyp <- hypotheses(mod, "cyl6 = cyl8")
hyp
#>
#>         Term Estimate Std. Error    z Pr(>|z|)   S 2.5 % 97.5 %
#>  cyl6 = cyl8     4.64       1.49 3.11  0.00186 9.1  1.72   7.57
#>
#> Columns: term, estimate, std.error, statistic, p.value, s.value, conf.low, conf.highS Values
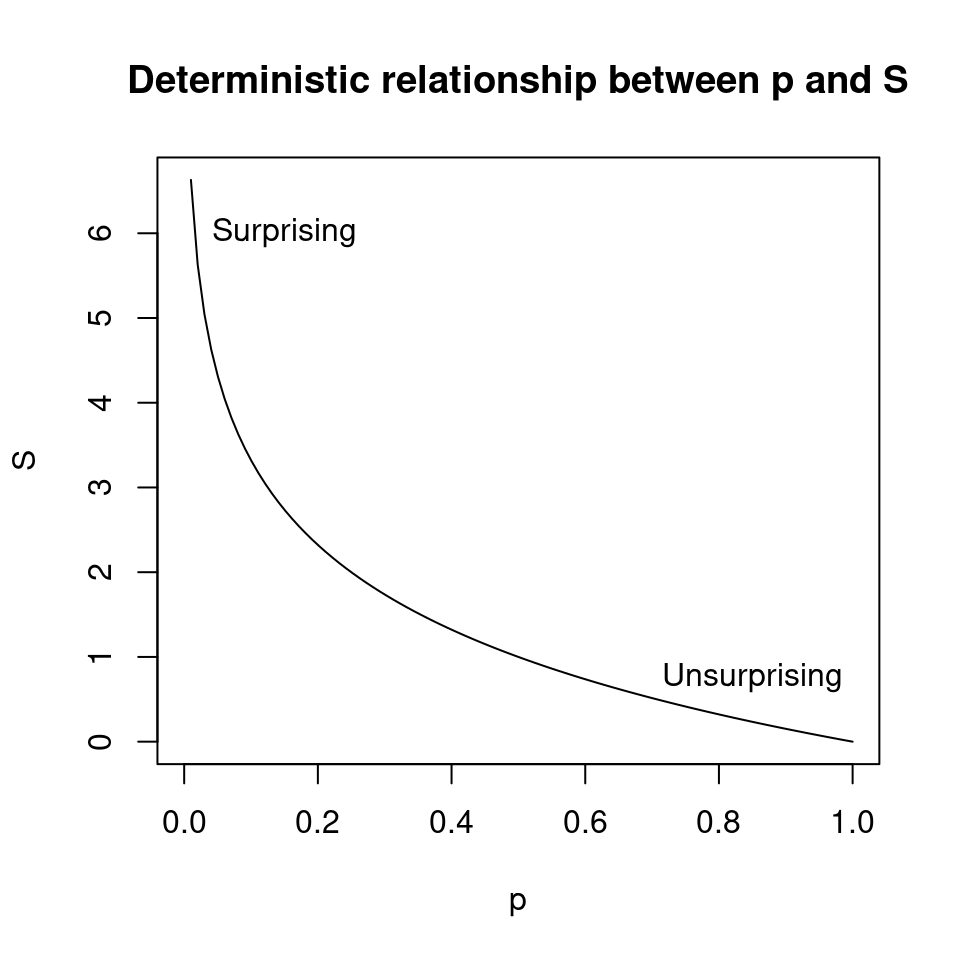
The S value — “Shannon transform” or “binary surprisal value” — is a cognitive tool to help analysts make intuitive sense of p values [@RafGre2020]. It allows us to compare a p value to the outcome of a familiar game of chance.
Consider this: We toss a coin 4 times to see if we can reject the null hypothesis that the coin toss is fair. If the null is true, the probability of drawing Heads on any single toss is \(\frac{1}{2}\). The probability of observing 4 Heads in a row is \(\left (\frac{1}{2} \right )^4=\frac{1}{16}=0.0625\). This probability characterizes the “surprise” caused by observing 4 straight heads in a world where the null holds, that is, where the coin toss is fair.
Now consider a different exercise: We estimate a model and use marginaleffects::hypotheses() to test if two of the estimated coefficients are equal:
The difference between cyl6 and cyl8 is 4.64, and the associated p value is 0.0018593. Again, the p value can be interpreted as a measure of the surprise caused by the data if the null were true (i.e., if the two coefficients were in fact equal).
How many consecutive Heads tosses would be as surprising as this test of equality? To answer this question, we solve for \(s\) in \(p=\left (\frac{1}{2} \right )^s\). The solution is the negative \(log_2\) of p:
-log2(hyp$p.value)
#> [1] 9.070986
Indeed, the probability of obtaining 9 straight Heads with fair coin tosses is \(\left (\frac{1}{2} \right )^9=0.0019531\), which is very close to the p value we observed in the test of coefficient equality (see the S column in the marginaleffects printout above). Comparing our p value to the outcome of such a familiar game of chance gives us a nice intuitive interpretation:
If the
cyl6andcyl8coefficients were truly equal, finding an absolute difference greater than 4.64 purely by chance would be as surprising as tossing 9 straight Heads with a fair coin toss.
The benefits of S values include [@ColEdwGre2021]:
- Calibrates the analyst’s intuitions by reference to a well-known physical process (coin flips).
- Avoids the problematic dichotomization of findings as “significant” and “not significant” [@Rot2021].
- Reduces the reliance on arbitrary thresholds of significance like \(\alpha=0.05\).
- Guards against the common misinterpretation of p values as the “probability that the null hypothesis is true” or as the probability of the alternative hypothesis. This is in part because S is above 1 whenever p<0.5.1
- Refers to a more natural scale: “The difference between a p value of 0.99 and 0.90 in terms of how surprising the observed test statistic is, is not the same as the difference between 0.10 and 0.01.”2